
As you may know by now, NOISY devices continuously monitor your environment for airplane noise. Once a device detects an airplane, it records the start time, the noise level (second by second), and the end time of the flyover event. It combines this data with flight information for each flight, such as the tail-number, the airline operating the airplane, flyover height, and so on. All this information can then be viewed online or downloaded. On the NOISY webpage, you can visualize all past fly-over events detected by your device, regardless whether they happened a minute, a month, or a year ago. Noisy provides then statistics on what happened at your location, such as how many flights were detected during a time interval (say, last week), how many of them were louder than a particular threshold, and how many happened during nighttime hours.
The Noisy webpage allows you to combine this information into reports, including lists of the airplanes ranked from loudest to quietest, and when those loud events happened. Let’s look at some examples. This is a screen-shot that shows in the upper panel the measured noise levels (dBA, grey) and the detected flights (blue) between roughly 12:45 PM and 4:00 PM at a location close to Chicago O’Hare.
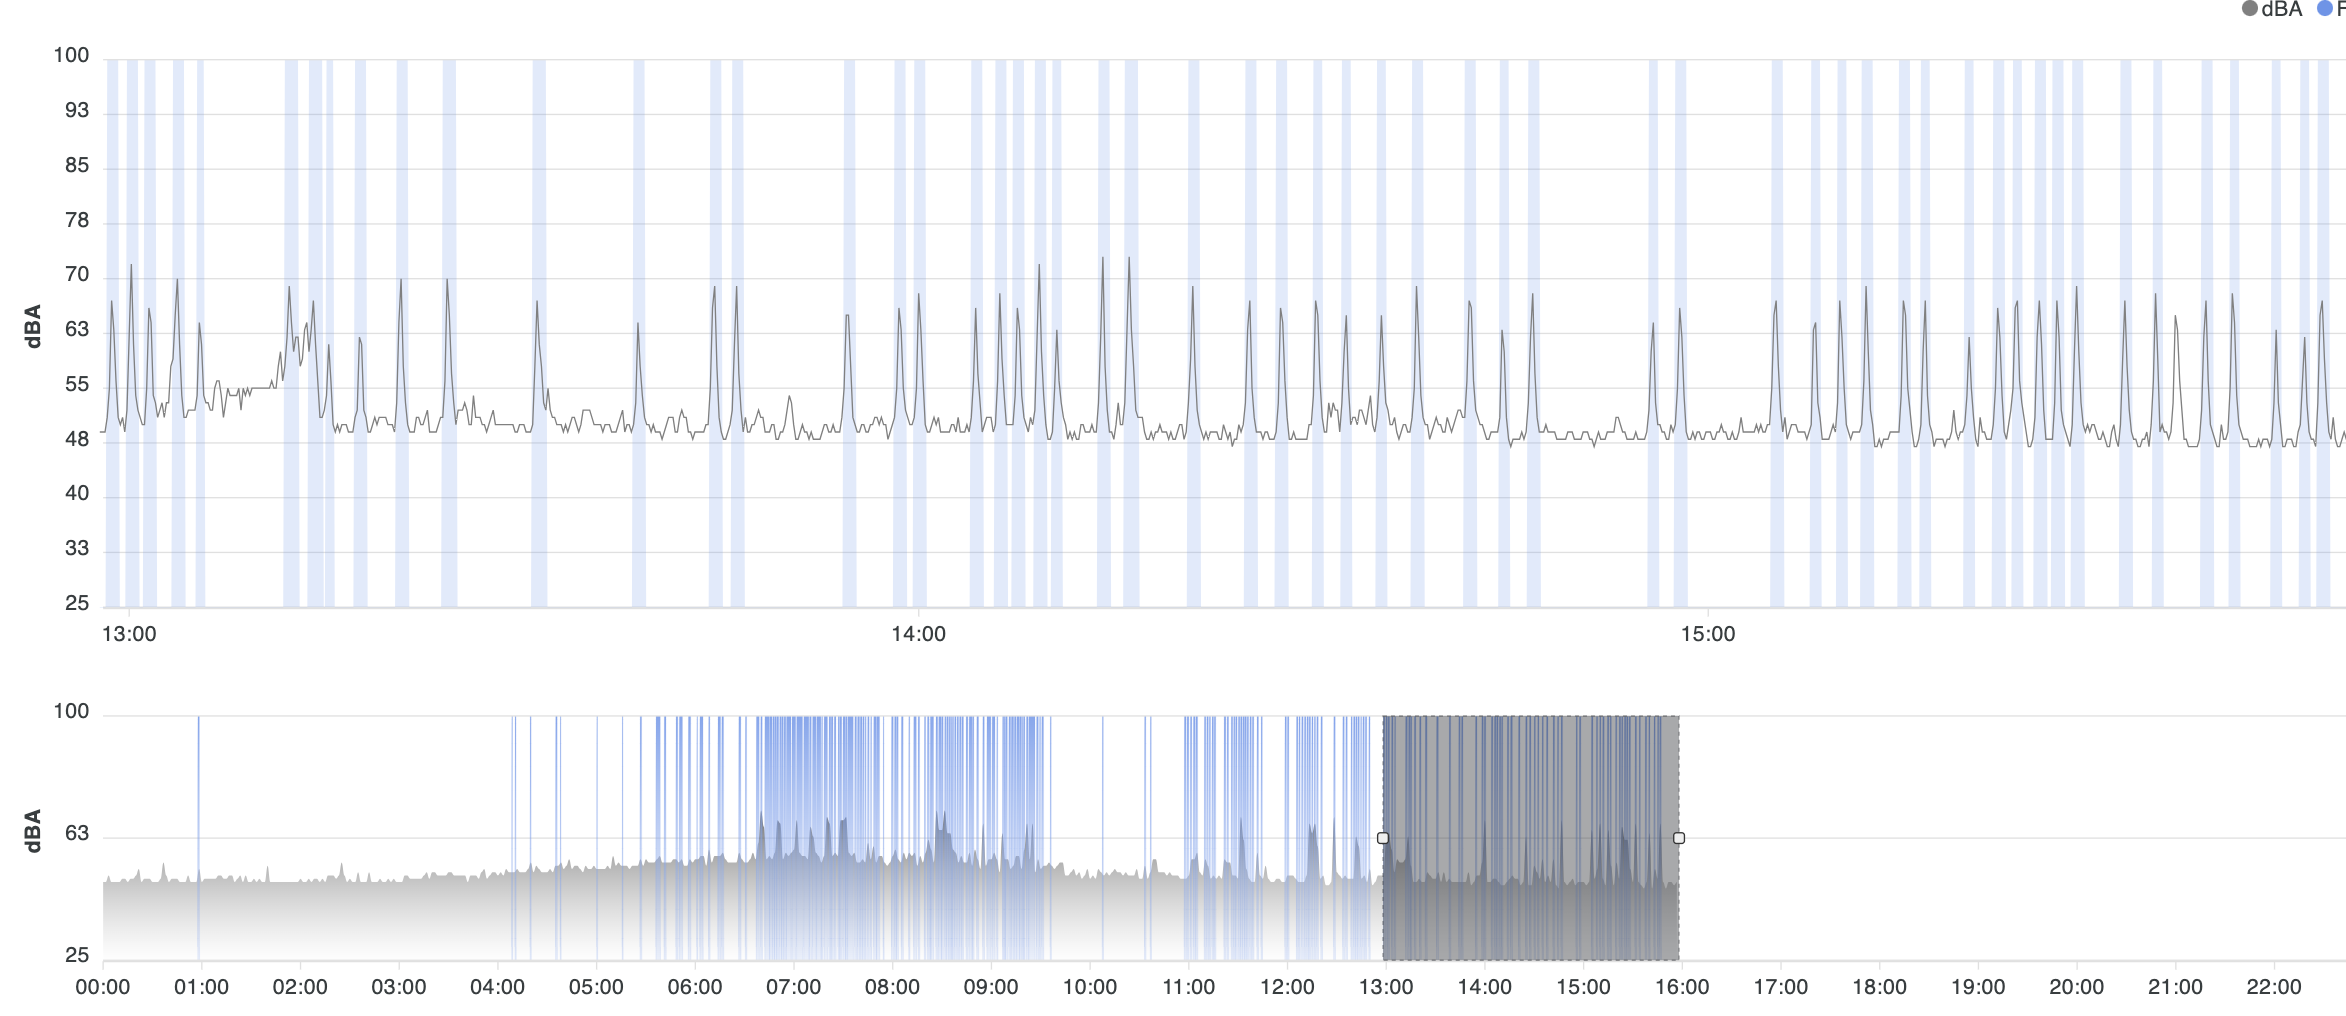
On the lower panel you see the distribution of noise a flights for a whole day in that location. The shaded area in grey shows you the same data as in the upper panel. The data in this screen-shot shows you what a Noisy device can do, but also what it cannot: consider the time period around 1:15 PM (upper panel). During that time period, there has been especially loud noise either from multiple planes simultaneously or possibly also other sources (such as construction or street cleaning machinery noise) that made it harder for our system to separate individual source noise information. Consequently, we do not know exactly how many airplanes have actually been flying over this location during that time-span, as the device was only able to detect two. Note the nighttime slow-down in flyover events before 4 AM and after 9:30 AM till about 11:00 AM (lower panel). As you can see, there also have been a flights detected very early in the morning.
Let’s look at the culprits – here are all the flights that were measured to be louder than 60 dBA for the same time period. The top of the list shows that there were 236 flyover events total, and 197 were louder than 60 dBA. The list itself shows when each event started and ended, how loud it was, the flight number and a hexadecimal airplane identifier, and the distance from the device:
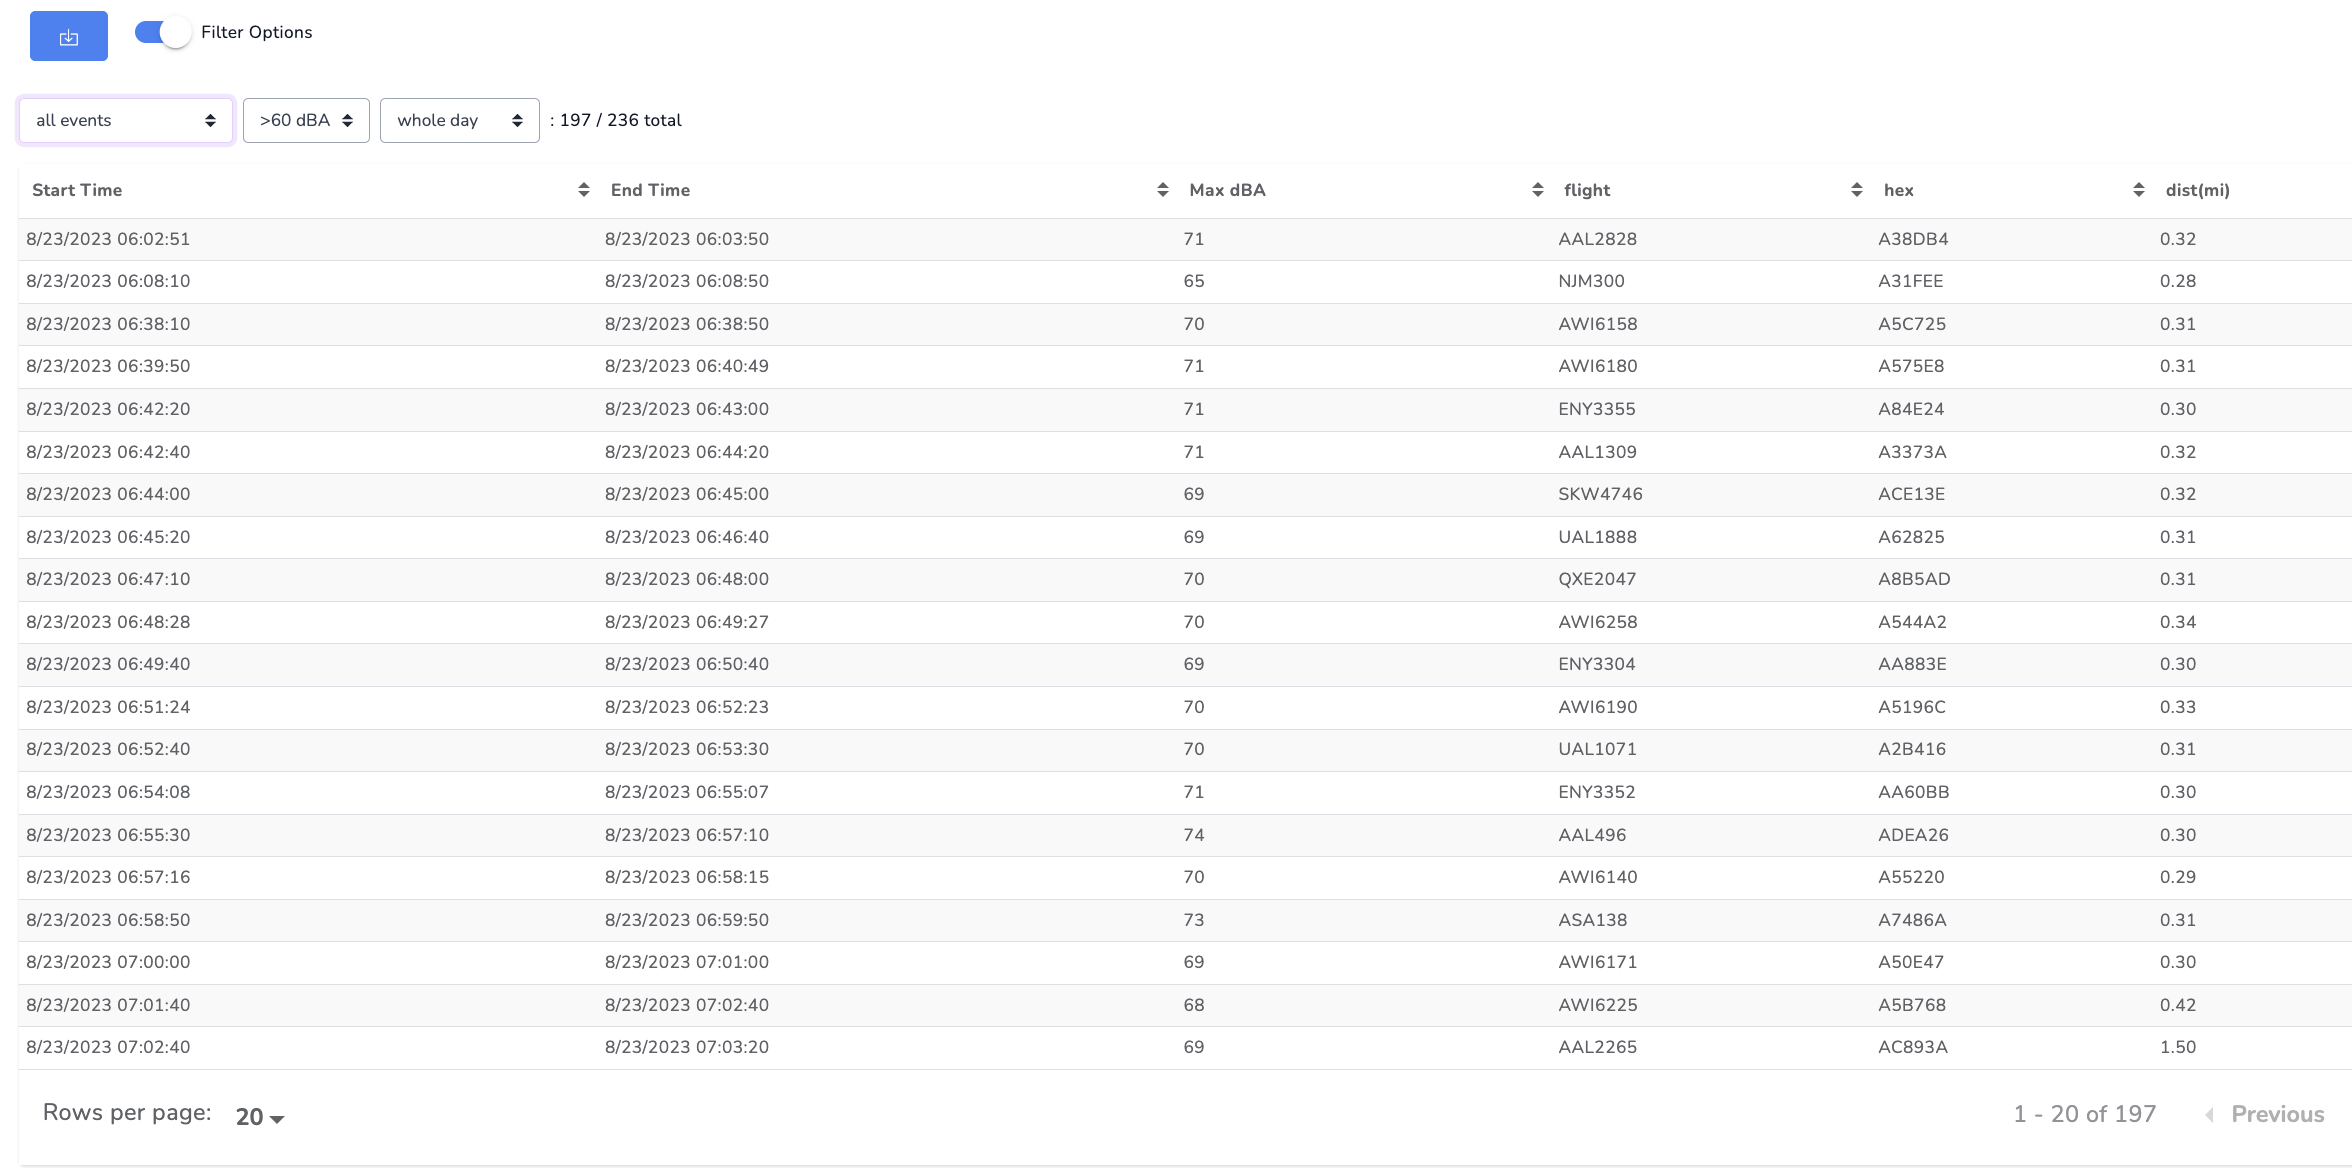
The list can be sorted by each one of these criteria. Now all this individual data can be used to create some visualizations and statistics. Here, for example, is a graph that shows how many airplanes were detected hourly during a week, with each line representing a particular day of the week. The horizontal axis lists the hour (in 24-hour format), and the vertical axis the number of planes:
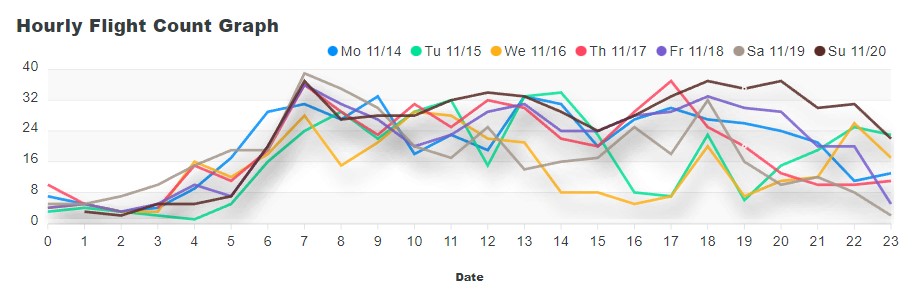
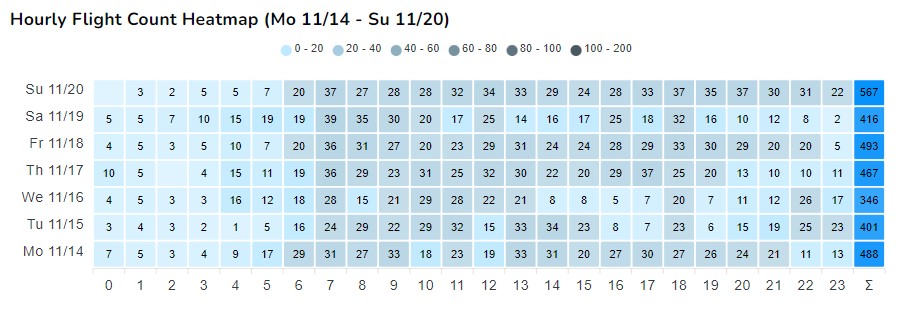
Another way to visualize this is in a so-called heatmap for weekly flyover events. Each row of the following table represents a day of the week, and each cell within a day represents an hour. The number in each cell shows flyover counts within the hour, and larger numbers are reflected by darker colors in the cell (showing higher flyover density or “heat”). The right-most column shows the total count of flights in a particular day.
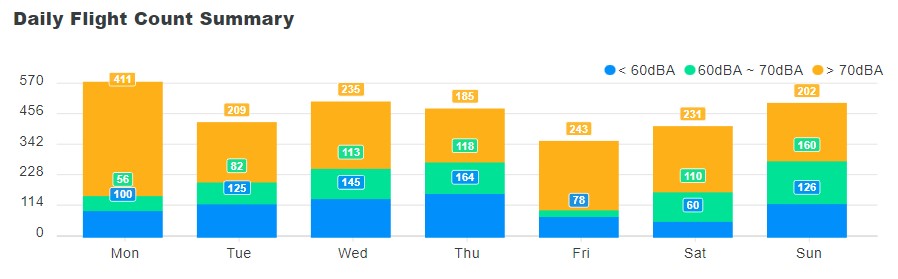
But maybe you are rather interested in the number of loud planes per day? Well, here you can see it – each column represents a day, the height of the column the total number of planes per day, with the loudest planes in yellow, followed by the not so loud ones in green and blue:
Of course, if you would rather like to create your own data visualizations, you can simply download the data and create your own. Here is an example of a more artistic rendering (not available directly from the website) based on the downloadable data:
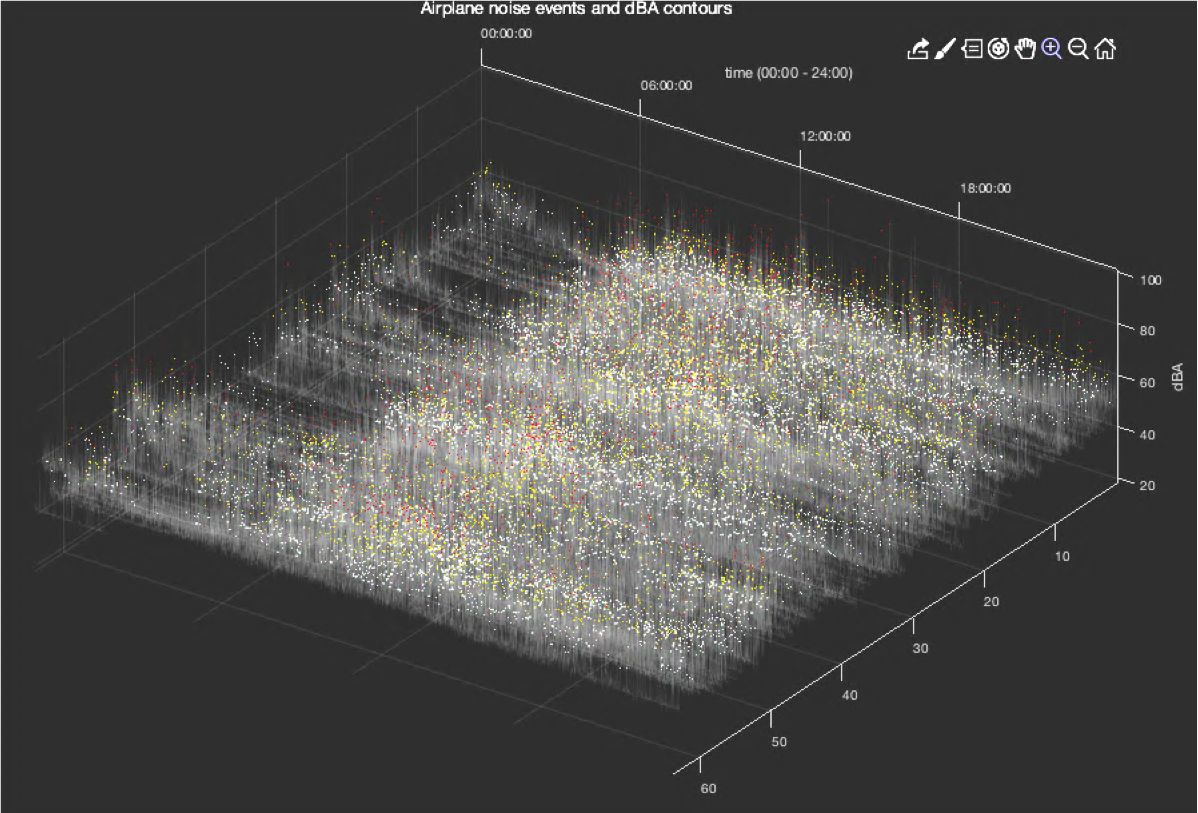
Each point represents a flyover event, and the darker the color, the louder the airplane – red dots represent the loudest airplane flyover events.
We hope we were able to convince you that each NOISY opens the door to the universe of noise measurement at your home. If you need to know exactly how loud it is at hour home and how often loud events occur, or need to convince someone else that this is the case, NOISY is for you.